Your Shopping Cart is empty.


Download sample
File Details
Published: 2023-05-20 12:27:52.079436 Category: Science Type: Vector Model release: No
Share
       

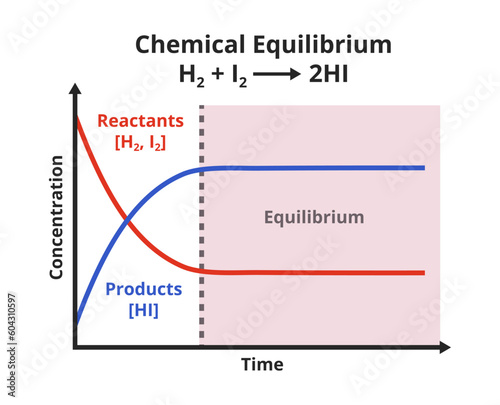
Vector scientific graph or chart of chemical equilibrium – how the chemical reactant and product concentrations change with time. Attainment of equilibrium during the synthesis of hydrogen iodide.

Contributor: petrroudny
ID : 604310597

TitleFilesize
Vector4307x3483


Buy on Adobe Stock

Keywords
concept, equilibrium, product, education, chemistry, reaction, science, illustration, diagram, graphic, synthesis, hydrogen, state, design, background, chart, property, graph, rate, abstract, dynamic, change, presentation, definition, iodine, symbol, learning, chemical, scientific, white, infographic, process, line, vector, concentration, formula, forward, physics, student, system, time, reverse, kinetic, datum, experiment, figure, growth, increase