Published: 2025-04-04 01:29:37.765599Category:BusinessType:VectorModel release: No
Share
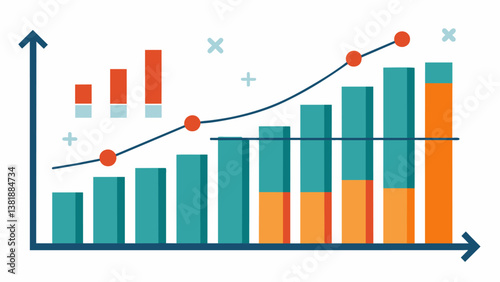
A line graph shows a steady increase in sales over the past five years while a corresponding bar graph demonstrates the decrease in operating expenses during the same period.. Vector illustration
)